America's Two Nicotine Maps: Where It Smokes vs. Where It Vapes
MAP SO HARD · June 29, 2026
Two leaderboards that almost rhyme
Cigarettes and e-cigarettes are different products with different histories, so you might expect the states that smoke the most and the states that vape the most to be two different lists. They aren't — not entirely. Look at the top of our most adult smokers map and the top of our most vapers map and you see the same handful of states circling each other.
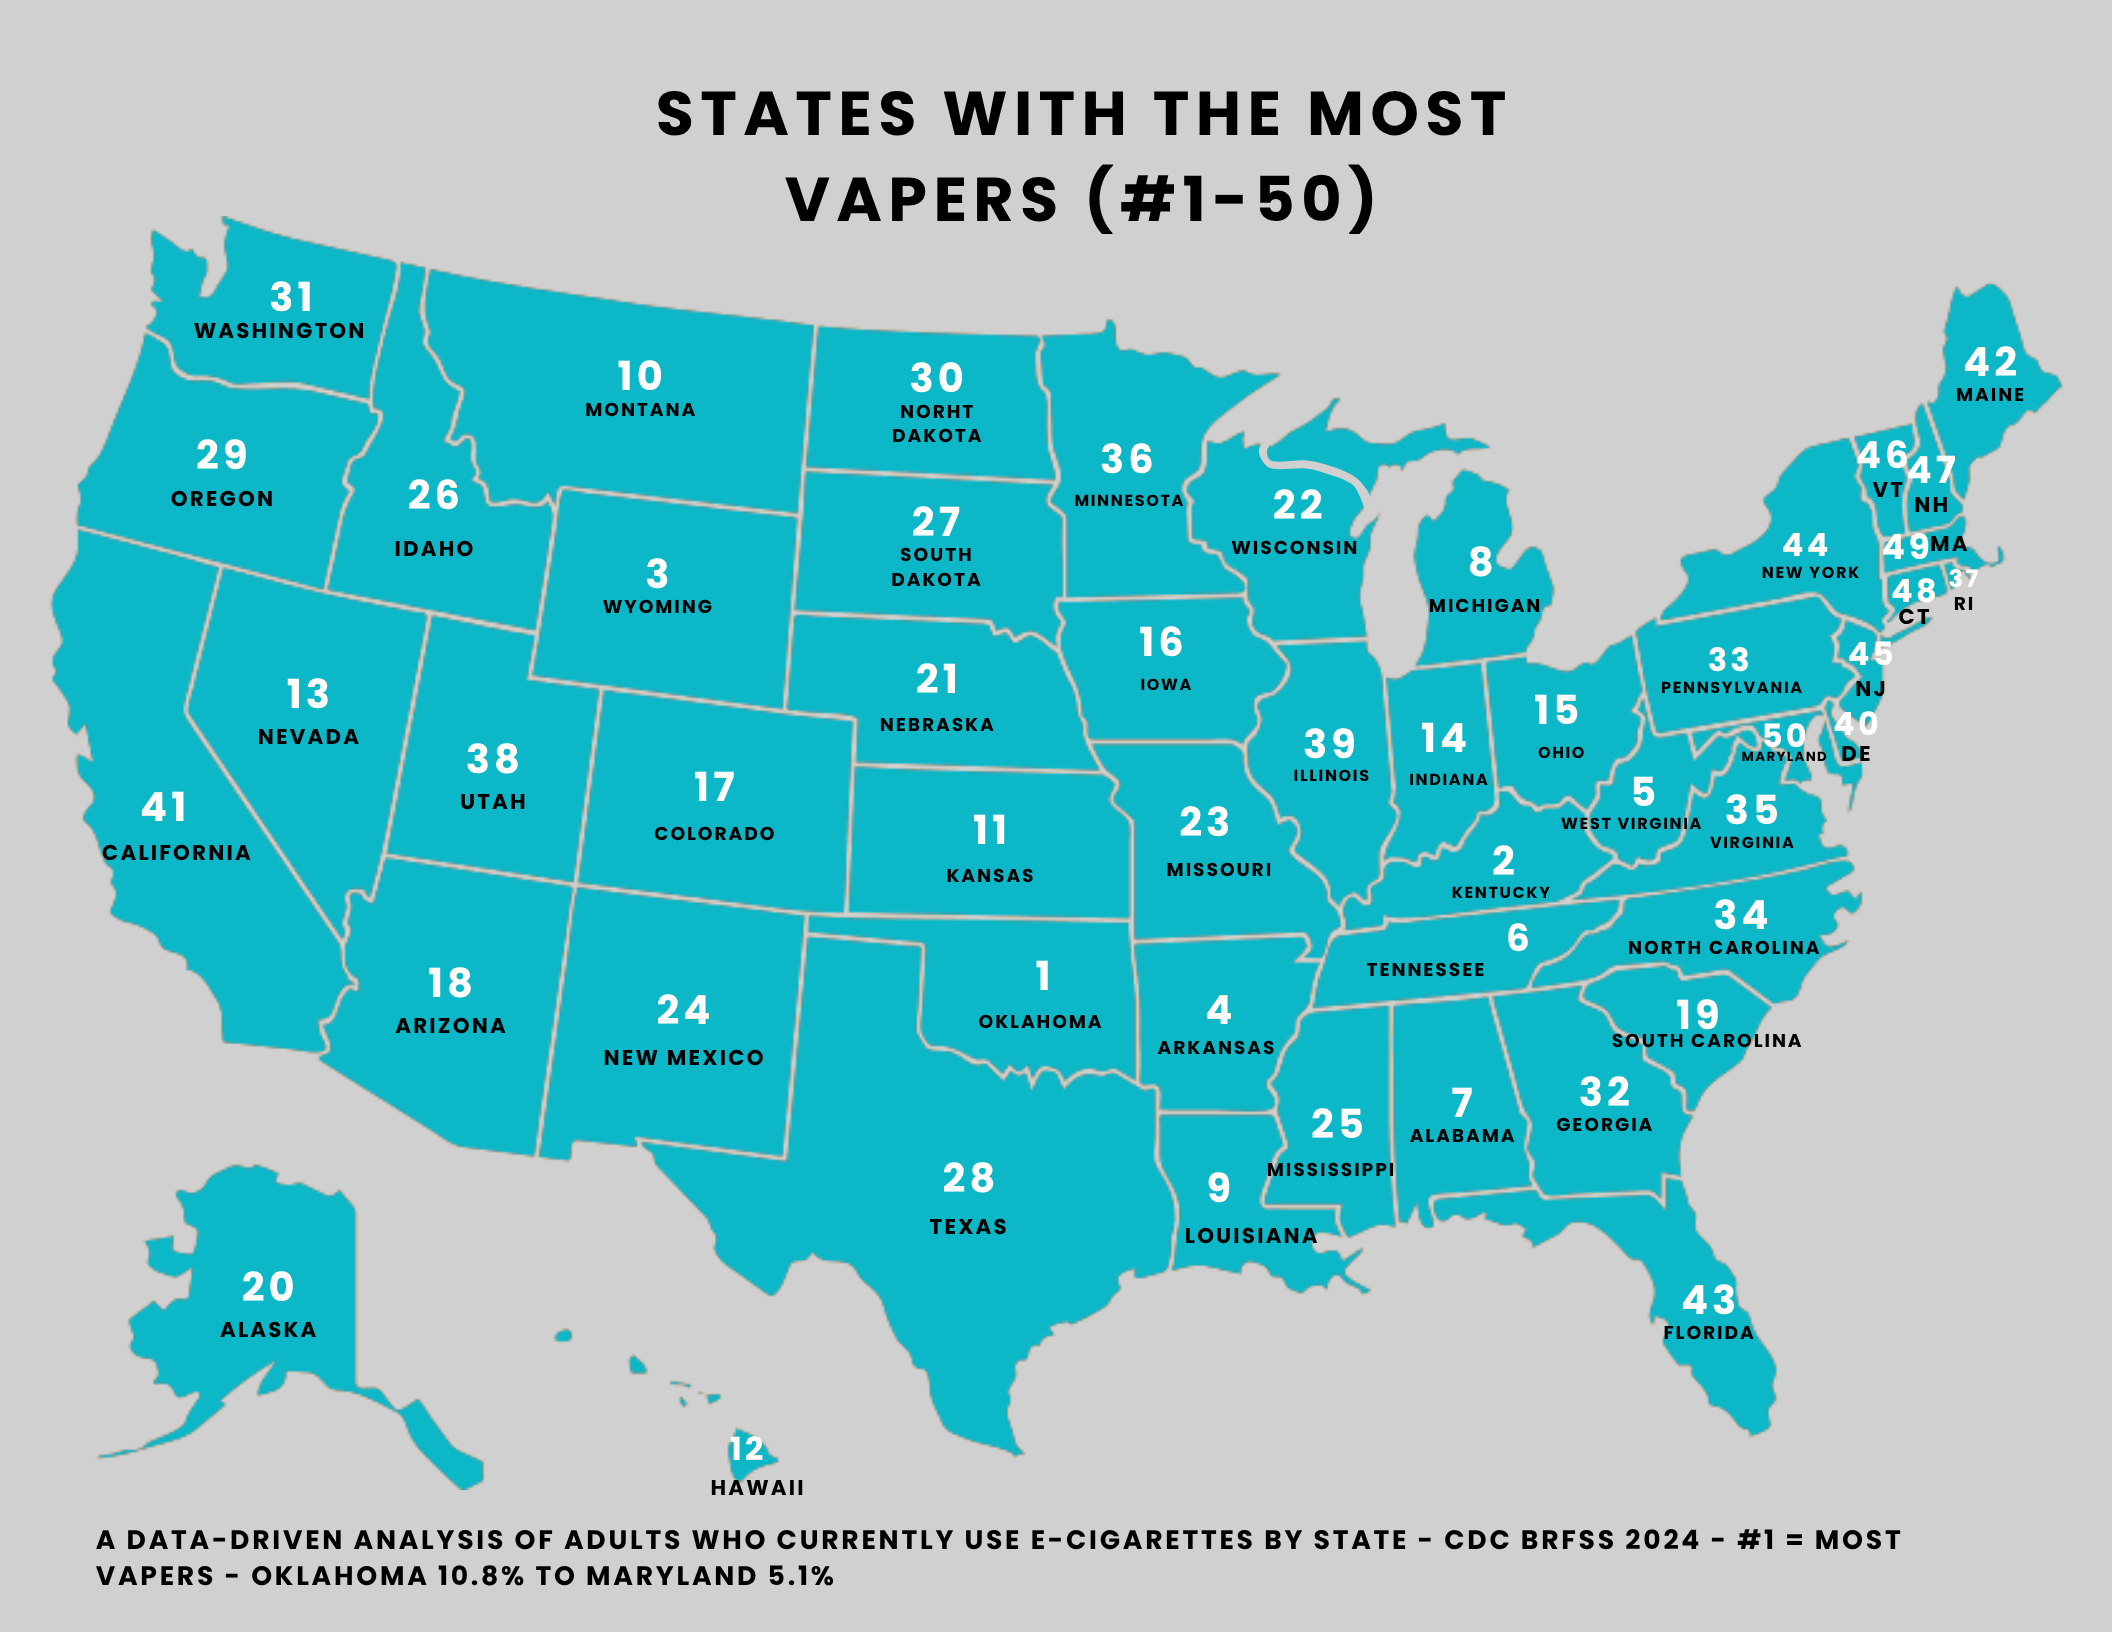
Smoking's leaderboard is anchored in Appalachia and the South-Central states. West Virginia tops it at 20.78%, followed by Kentucky (17.18%), Tennessee (17.0%), Arkansas (16.47%), and Louisiana (15.03%). Now look at vaping. The order shuffles, but the geography barely moves: Oklahoma leads at 10.79%, then Kentucky (10.74%), Wyoming (10.70%), Arkansas (10.68%), West Virginia (10.47%), and Tennessee (10.20%). Four states — West Virginia, Kentucky, Arkansas, and Tennessee — sit in the top six of both. That overlap is the throughline of this piece: whatever pulls a state toward heavy cigarette use seems to track, loosely, with heavy vaping too.
It's worth being precise about what these numbers are. Both come from the same CDC survey and both measure current adult use — the share of adults who smoke now, or vape now. They don't measure how much, when someone started, or whether vaping replaced smoking or sits alongside it. Two states with similar percentages can have very different stories underneath. So when the maps line up, that tells us where use is common — not why, and not which product came first.
Where the two maps disagree
The interesting states are the ones that break the pattern, and there are two big ones.
Oklahoma is #1 for vaping (10.79%) but only #10 for smoking (14.05%). It leads the country on e-cigarettes while sitting outside the smoking top five entirely. West Virginia is the mirror image: #1 for smoking (20.78%) but #5 for vaping (10.47%). It owns the cigarette map but gets edged out on the vape map. If a single force drove both behaviors identically, you wouldn't expect this kind of swap at the very top — the same state would lead both. The fact that the #1 slots belong to different states suggests vaping has its own pull that doesn't perfectly trace the old smoking map.
There's a tempting story here — that vaping is "replacing" cigarettes in a state like Oklahoma — but the data we have can't support that claim, and we won't make it. These are two snapshots of current use in 2024, not a before-and-after. Oklahoma's high vaping rate may reflect newer adoption, an older smoking base, or measurement quirks; we genuinely can't tell from a single year of cross-sectional ranks. What we can say plainly is the ranking itself: Oklahoma vapes more than any other state, and West Virginia smokes more than any other state, and those are not the same place.
Note also how tight the vaping range is at the top. The gap from #1 Oklahoma (10.79%) to #6 Tennessee (10.20%) is under six tenths of a percentage point — these states are nearly tied. Smoking is far more spread out: West Virginia's 20.78% towers over the field. So "vaping leader" is a much closer race than "smoking leader," and small year-to-year shifts could reorder the vaping top six without telling us anything dramatic.
The cleaner stat is the bottom of the maps
Top-of-list rankings get the attention, but the bottoms of these two maps are where the contrast sharpens. For smoking, the lowest states are California (#49, 7.61%) and Utah (#50, 5.72%) — Utah's smoking rate is just over a quarter of West Virginia's. For vaping, the floor sits in the Northeast: Massachusetts (#49, 5.61%) and Maryland (#50, 5.14%).
That's a real divergence worth sitting with. The states that vape least — Massachusetts and Maryland — aren't the same as the states that smoke least. Utah is the smoking-map outlier; the Northeast is the vaping-map floor. So the two products don't just share a high-use region, they have different low-use regions. A clean reading: high cigarette and high e-cigarette use both lean Appalachian and South-Central, while the lowest e-cigarette use clusters in the Northeast. Anything beyond that — culture, policy, age structure, price — is interpretation we'd need other data to test, and these maps alone don't carry it.
The honest summary is modest but real. There is one shared high-use core, anchored by Kentucky and Arkansas, that ranks near the top of both maps. There are two telling exceptions — Oklahoma and West Virginia — that trade the #1 spot. And there are two different floors. Same broad region up top, different regions at the bottom: two maps that rhyme without repeating.
Both figures come from the CDC's Behavioral Risk Factor Surveillance System (BRFSS), 2024, measuring current adult cigarette smoking and current adult e-cigarette use. Tennessee's value on both maps reflects 2023, the most recent year CDC reported for that state; it is disclosed per row. The numbers are CDC's; the rankings and analysis are ours.