The Cost of Energy: What Gas Prices and Electric Bills Reveal
MAP SO HARD · June 29, 2026
Two energy bills, two different maps
Ask anyone what they pay to keep their life running and they'll usually point to two numbers: what it costs to fill the tank, and what it costs to keep the lights on. We rank all 50 states on both — most expensive gas and highest electric bills — and the instinct is to expect the same states near the top of each. A high-cost state is a high-cost state, right?
The maps say otherwise. California leads the country on gasoline at $6.08 a gallon, but it doesn't appear anywhere near the top of the electric-bill rankings. Texas is one of the cheapest places in America to buy gas — #49 at $3.92 — yet it lands at #6 for electric bills at $164 a month. Two essential costs, two almost unrelated leaderboards. That gap is the whole story here, and it tends to come down to what each number is actually measuring.
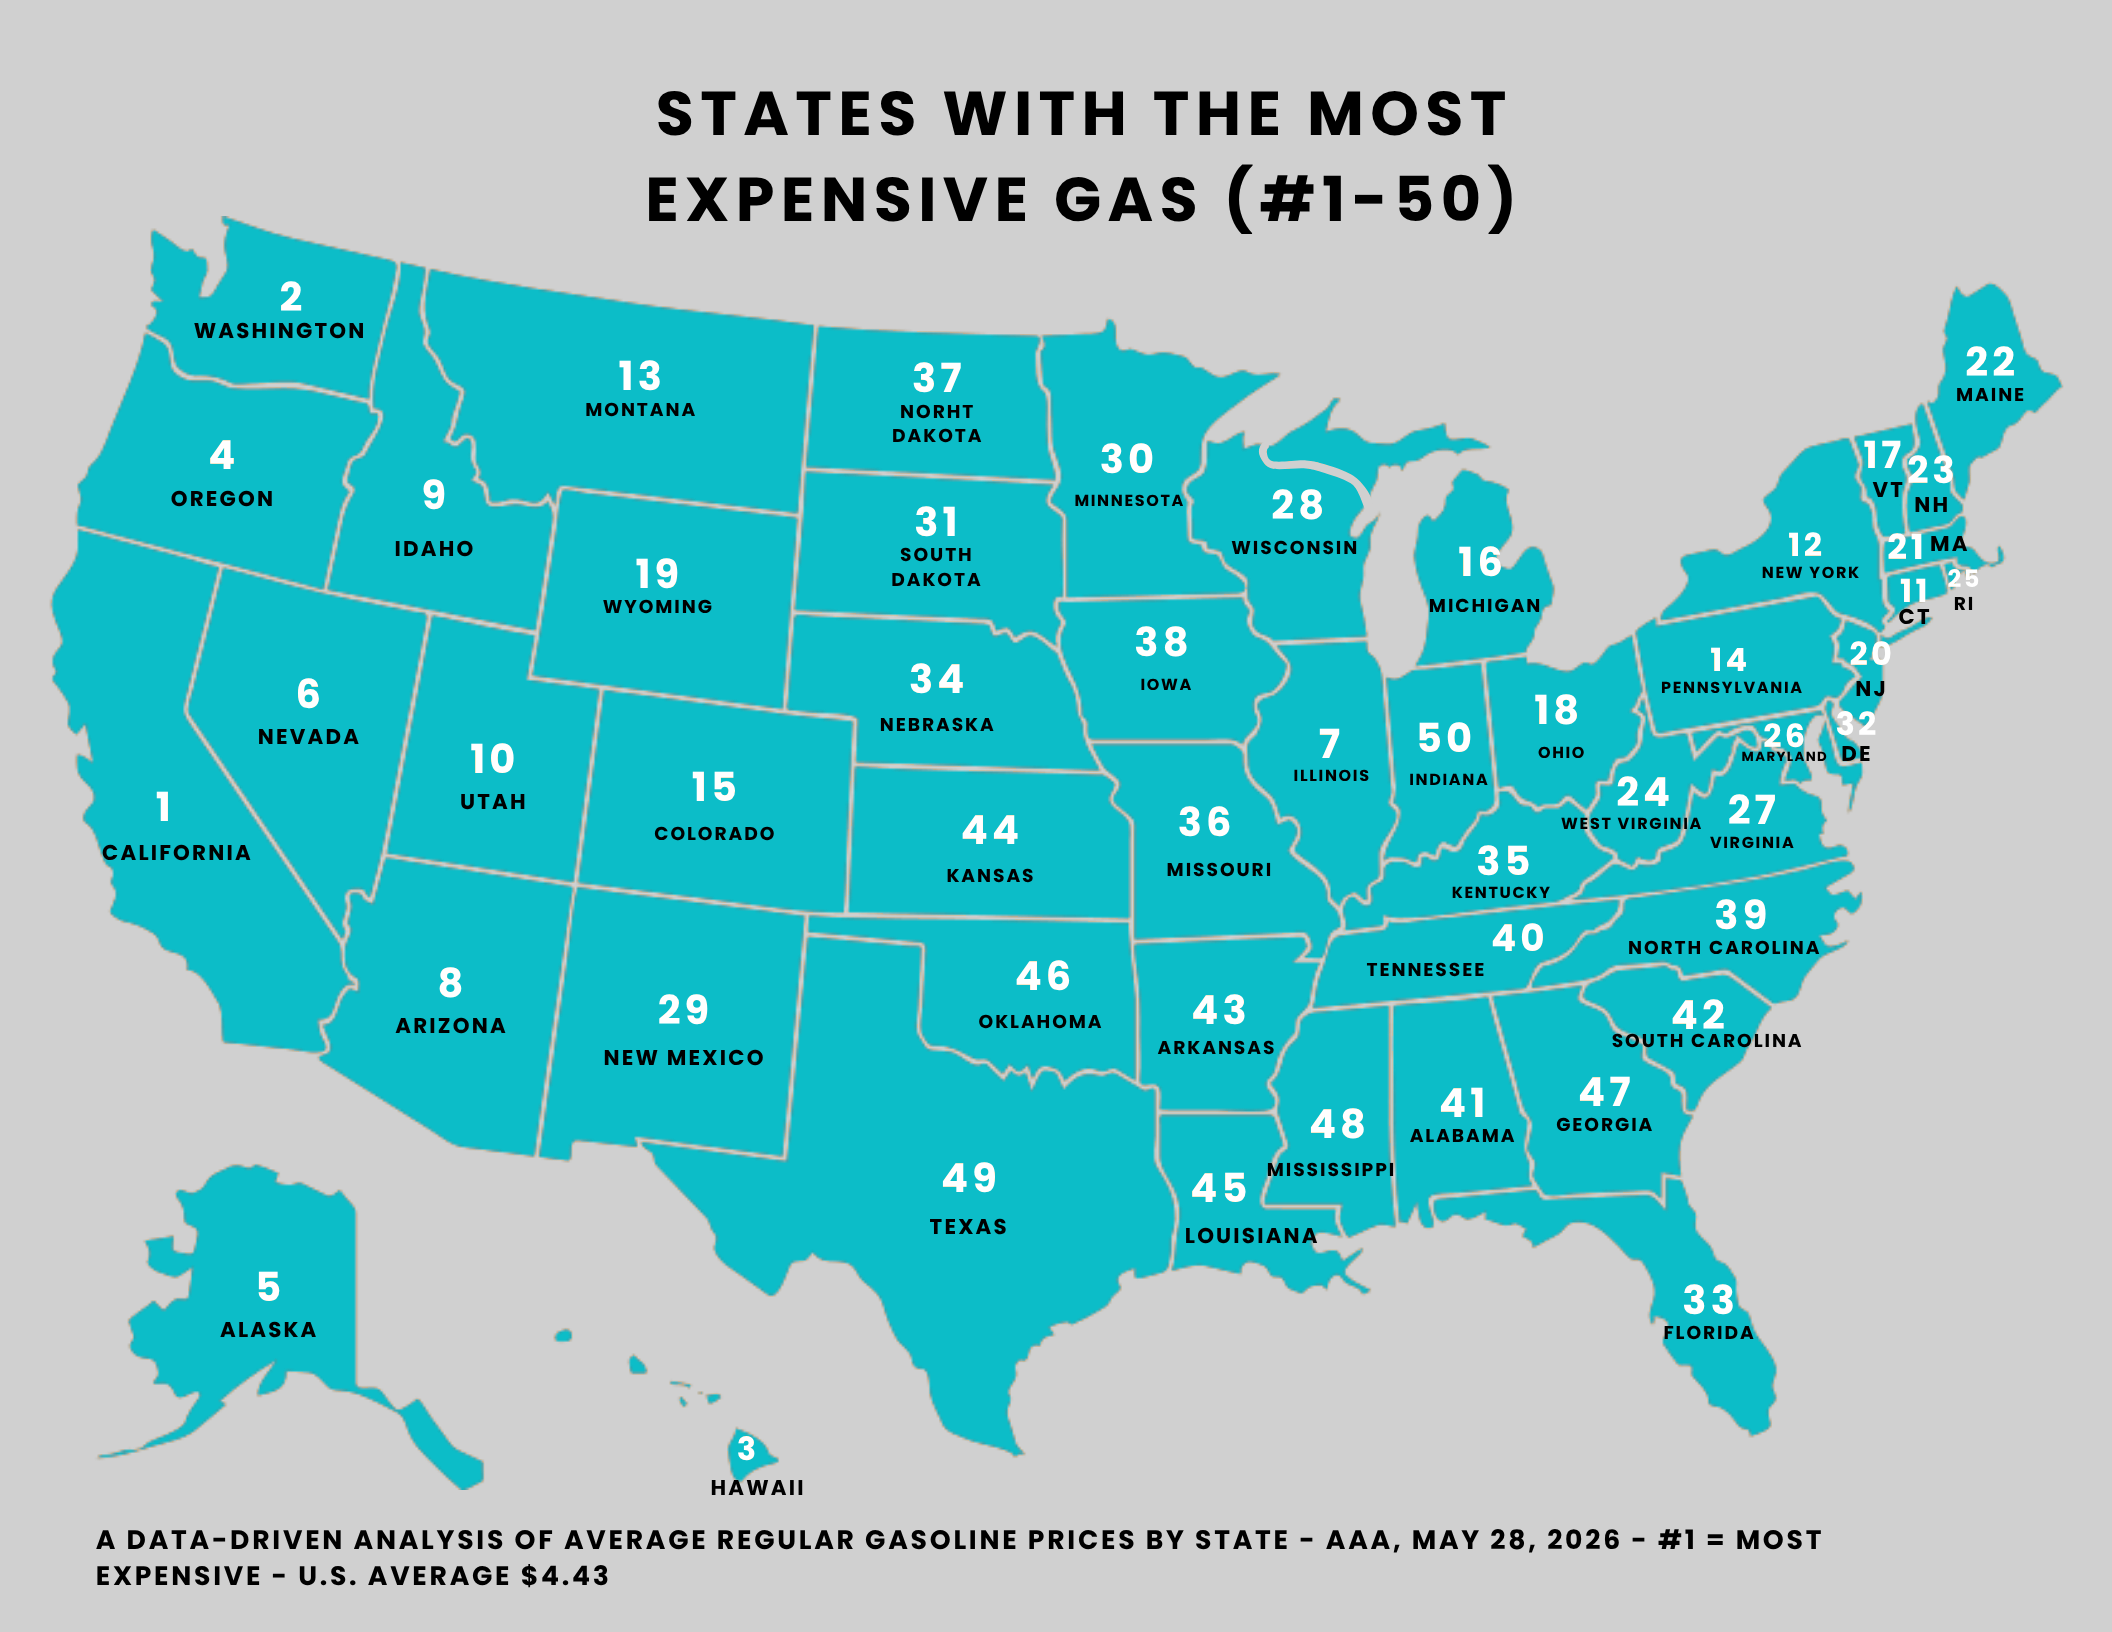
The gas map runs down the Pacific coast
The top of the gasoline ranking reads like a West Coast travel itinerary. California ($6.08) is #1, followed by Washington ($5.74) at #2, Hawaii ($5.66) at #3, Oregon ($5.27) at #4, Alaska ($5.26) at #5, and Nevada ($5.22) at #6. Every one of the six most expensive states sits in the Pacific or Mountain West. Meanwhile the cheapest pumps are clustered elsewhere: Indiana ($3.82) is dead last at #50, just below Texas ($3.92) and Mississippi ($3.93).
A spread like this — more than $2.25 a gallon between California and Indiana — likely reflects forces specific to fuel rather than to energy in general. State fuel taxes vary widely, and the West Coast tends to sit at the higher end. Several of those states also require special cleaner-burning gasoline blends that aren't sold everywhere, which can thin out supply. And geography plays a role: states far from major refining hubs may carry higher transportation costs to get fuel to the pump. None of these is the single cause, and we won't pretend to weight them — but together they're the kind of thing that tends to push a regional cluster like the Pacific coast to the top while leaving the refinery-adjacent interior cheap.
The electric map answers a different question
Now look at electric bills, and the geography scrambles. Hawaii ($212) tops this list too — one of only two appearances by a gas-leader near an electric-leader — but right behind it are states that never showed up on the gas map: Connecticut ($200) at #2, Alabama ($174) at #3, Massachusetts ($167) at #4, Maryland ($166) at #5, and Texas ($164) at #6. At the bottom sit New Mexico ($93), Utah ($95), and Colorado ($101).
The crucial thing to understand is what this metric is and isn't. The electric ranking is the average monthly residential bill — total dollars paid — not the price of a kilowatt-hour. A bill is rate multiplied by usage, and those two levers can pull in opposite directions. A state can have a moderate rate but a high bill simply because households there run the air conditioning hard for months at a time. That framing helps explain why hot-climate states like Alabama (#3) and Texas (#6) sit high here: heavier cooling demand tends to inflate the total bill even where the underlying rate isn't extreme. A per-kWh map would almost certainly rank these states differently — usage is doing a lot of the work in a total-bill ranking, and that's a feature worth keeping in mind before reading too much into any single position.
Why Texas is the cleanest illustration
If you want one state that proves the two maps measure different worlds, it's Texas. It is among the cheapest in the nation for gasoline (#49, $3.92) and among the most expensive for electricity (#6, $164). Whatever keeps Texas gas cheap — proximity to refining, lower fuel taxes, the broad Sun Belt pattern — does nothing to lower a summer electric bill driven by cooling demand. The two costs simply don't travel together.
Hawaii is the opposite illustration: it's the rare state that ranks near the top of both, #1 on electricity ($212) and #3 on gas ($5.66). An isolated island grid and market, dependent on imported fuel with no neighboring states to draw cheaper supply from, may explain why both numbers run high at once where almost everywhere else they diverge. It's the exception that makes the rule visible: the top of one map rarely lines up with the top of the other, because gas and electricity answer to different forces. When you next see a headline about "the cost of energy," it's worth asking which energy — because there isn't one map, there are two, and they rarely agree.
Gasoline figures are AAA regular-grade averages, retrieved 2026-05-28; electric-bill figures are the U.S. Energy Information Administration's average monthly residential bills for 2024. The two metrics use different sources, periods, and definitions and are not directly comparable beyond the patterns described above. The numbers are AAA's and the EIA's; the rankings and analysis are ours.