Why West Virginia Ranks Worst on Almost Every Health Map
MAP SO HARD · June 29, 2026
One state, six #1 finishes
When you rank all 50 states on a health measure, the leaderboard is supposed to shuffle. The state with the most diabetes shouldn't automatically have the most arthritis; smoking and obesity are different behaviors with different causes. Yet across the CDC health maps we publish, one name keeps turning up in first place: West Virginia.
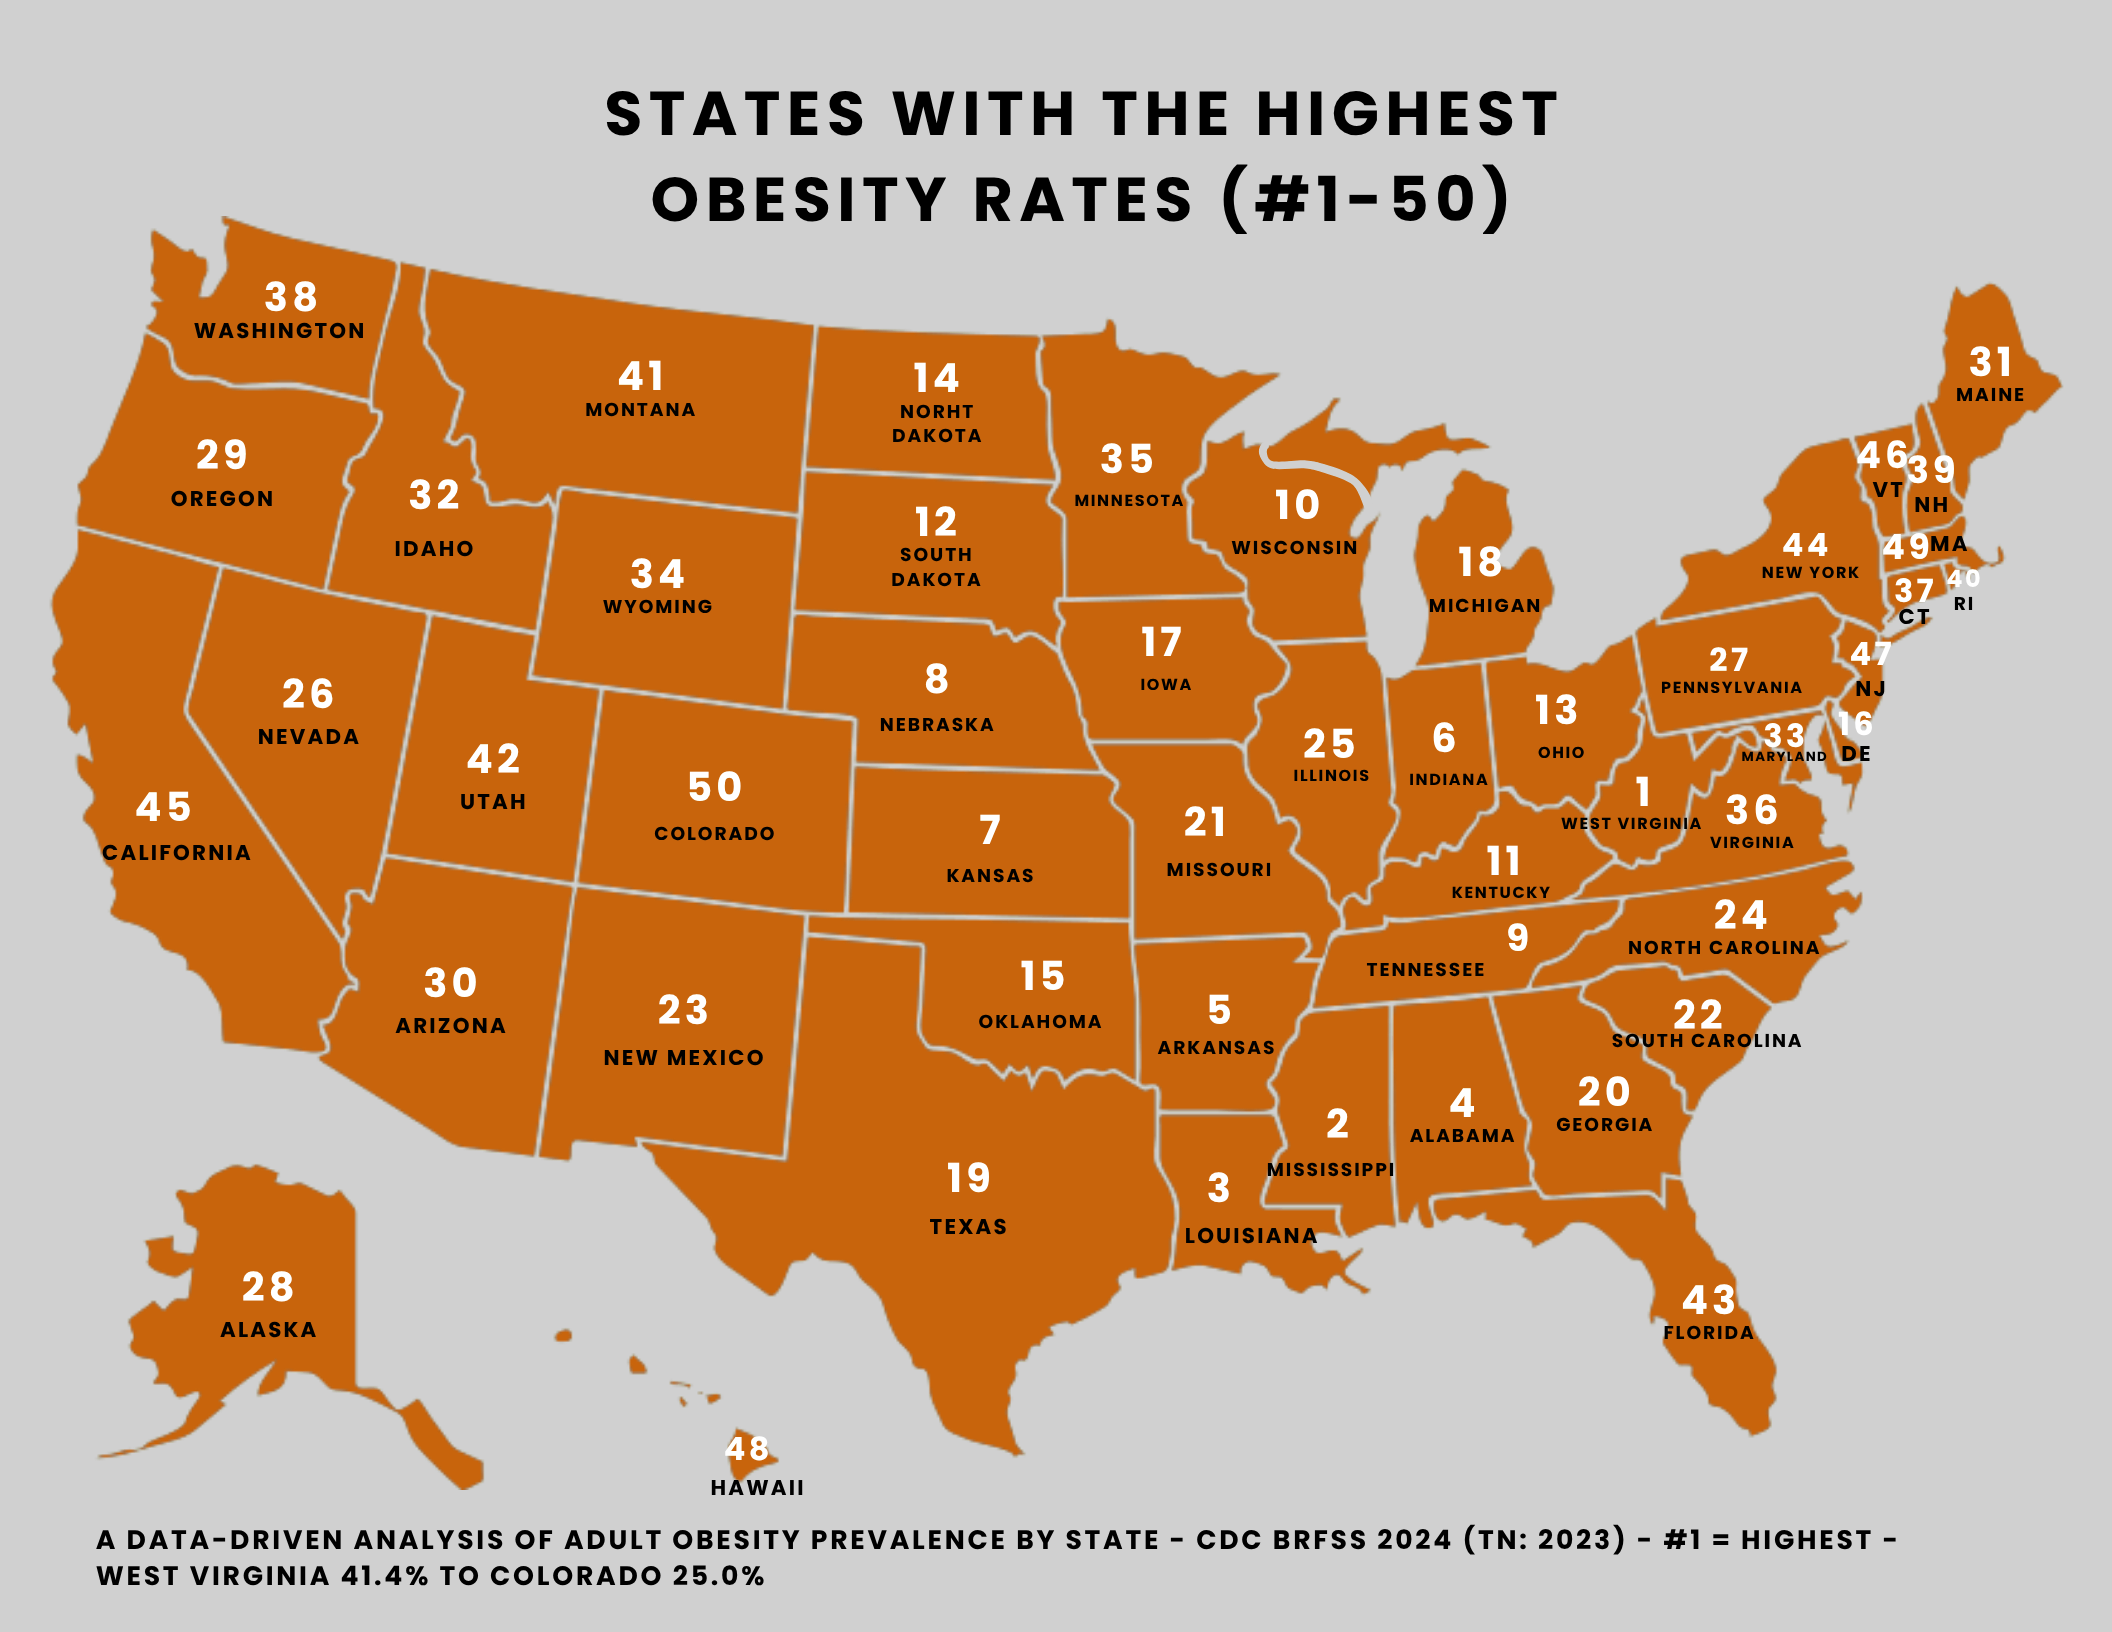
It is #1 for adult obesity (41.4%), #1 for adult smoking (20.78%), #1 for arthritis (41.22%), #1 for diagnosed depression (30.22%), #1 for diabetes (18.36%), and #1 for the share of adults who rate their own health as only fair or poor (26.31%). Six separate rankings, six first-place finishes. For good measure, it is #2 for physical inactivity (28.7%) and #5 for vaping (10.47%).
Each of these is measured independently in the CDC's survey, so this isn't one statistic wearing six costumes. When a single state tops all of them at once, the maps are pointing at something larger than any one condition.
The cluster behind the leader
West Virginia rarely sits at the top alone. Look at the names just beneath it and the same neighbors keep reappearing. On obesity, the top five are West Virginia, Mississippi (40.4%), Louisiana (39.2%), Alabama (38.9%), and Arkansas (38.9%). On smoking: Kentucky (17.18%), Tennessee (17.0%), Arkansas (16.47%), and Louisiana (15.03%). On diabetes, the top seven — West Virginia, Kentucky, Louisiana, Arkansas, Mississippi, Alabama, and Tennessee — form an unbroken band from the central Appalachians down to the Gulf Coast.
This is the cluster that defines the bottom of America's health maps: a contiguous stretch of Appalachia and the Deep South where chronic conditions concentrate together. These outcomes plausibly reinforce one another — excess weight feeds diabetes, inactivity feeds both, arthritis makes movement painful, and a "fair or poor" self-rating is the one-line summary residents give to all of it at once. A 50-state ranking can't prove that any one causes another, but the overlap is hard to miss.
The exception that proves the point
If West Virginia's high ranks simply meant "this state reports everything as bad," you would expect it to top our drinking maps too. It doesn't — and that's the most revealing detail of all.
On heavy drinking, West Virginia drops to #43 (4.85%). On binge drinking, #44 (13.32%). The states that lead those maps are a completely different crowd: Montana (9.81%) heads heavy drinking and Iowa (20.4%) heads binge drinking, with the Upper Midwest, Northern Plains, and New England stacked behind them. Alcohol has its own geography, and it isn't Appalachia's.
So the health cluster isn't an artifact of how one region answers a survey. West Virginia ranks worst on the conditions tied to weight, tobacco, and chronic disease, and middle-of-the-pack or lower on alcohol. The maps are tracking something specific, not a mood.
What these maps can and can't tell you
One honest caveat. Several of these measures are self-reported, or capture diagnosed cases. Depression and arthritis count adults who say a doctor told them they have the condition, which blends true prevalence with how often people actually see a provider. Obesity is based on self-reported height and weight, which tends to understate it. None of that moves West Virginia off the top — it leads whether or not you account for those effects — but it is why we would never claim these maps measure the underlying biology to the decimal. They measure what people report and what gets recorded, which is closely related to, but not identical to, the reality on the ground.
What they show unambiguously is concentration. The same small group of states keeps landing at the top of one health ranking after another. If you want to understand where America's chronic-disease burden is heaviest, you don't need six maps — you mostly need one, and it has West Virginia at the top.
Every figure here comes from the CDC's Behavioral Risk Factor Surveillance System (BRFSS), 2024 — except Tennessee, shown with its latest available 2023 value where it appears. The percentages are CDC's; the rankings and the analysis are ours. Browse the full 50-state maps for obesity, smoking, arthritis, depression, diabetes, and self-rated health.