Binge Drinking
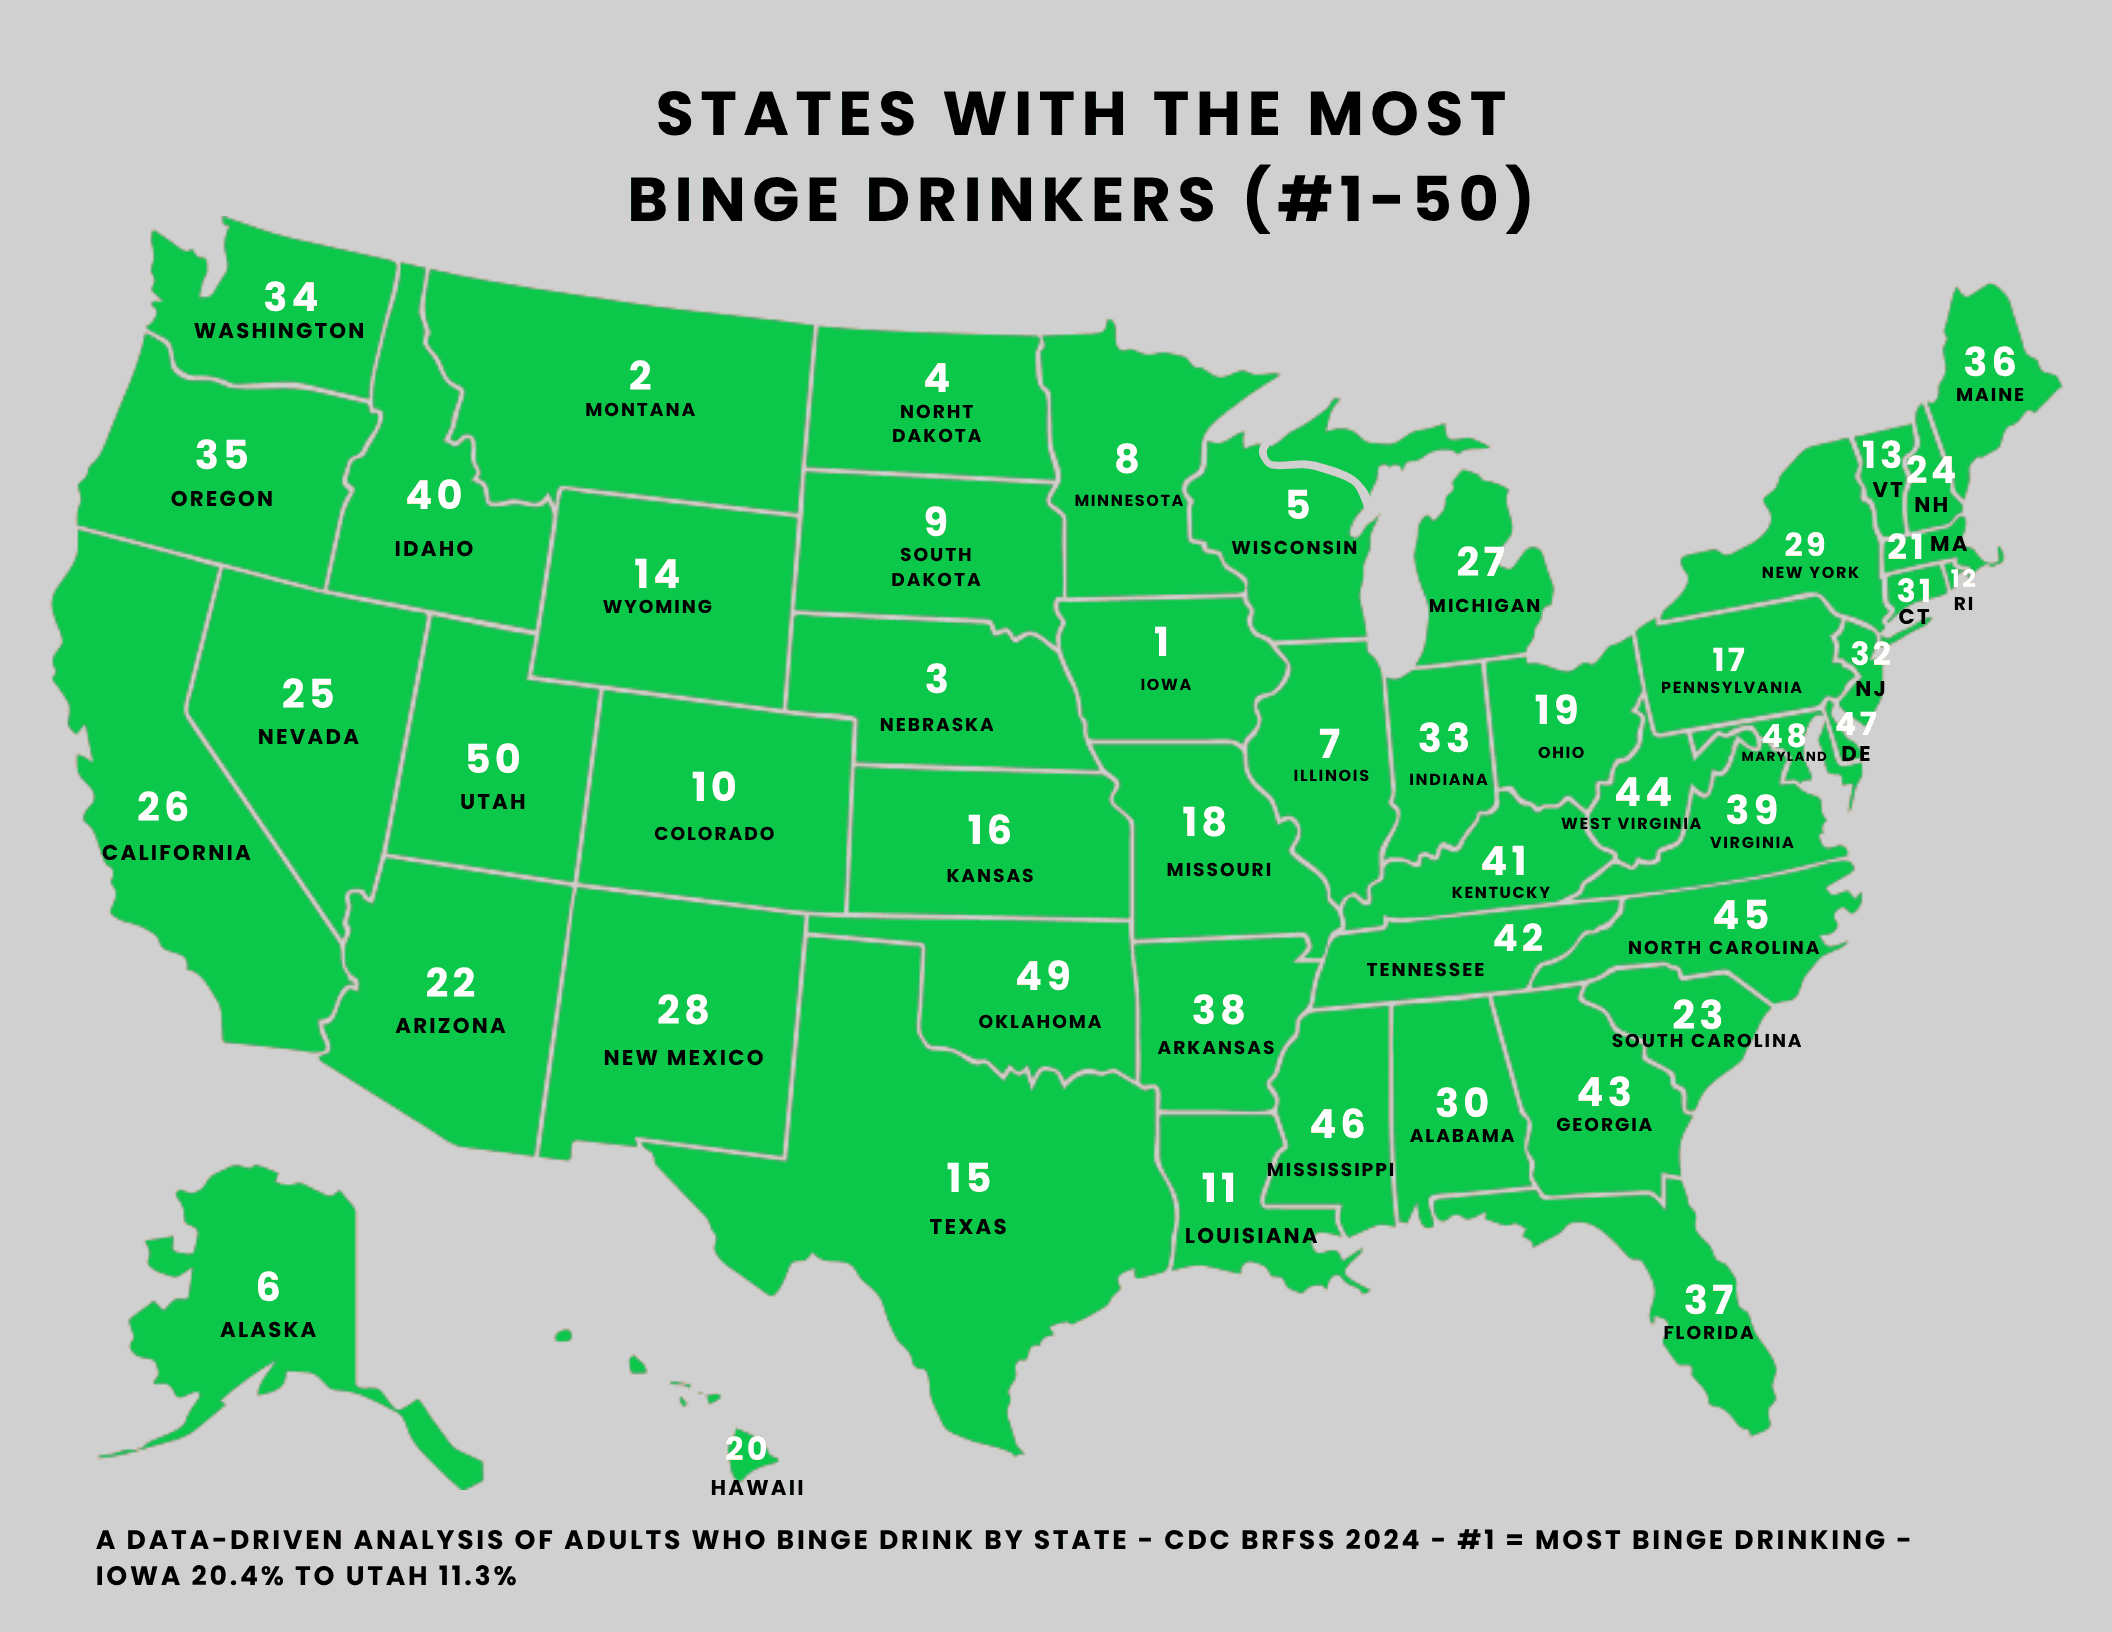
States with the Most Binge Drinkers
#1 = most binge drinking
- Period
- 2024
- Last updated
Full ranking — all 50 states
Sort by rank, state, or value. Ranks are ordinal (1 = highest by this metric). Ties are broken alphabetically by state name.
| Note | |||
|---|---|---|---|
| 1st | Iowa | 20.4% | CDC BRFSS, binge drinking 5+/4+ drinks on an occasion, 2024 |
| 2nd | Montana | 20.39% | CDC BRFSS, binge drinking 5+/4+ drinks on an occasion, 2024 |
| 3rd | Nebraska | 19.71% | CDC BRFSS, binge drinking 5+/4+ drinks on an occasion, 2024 |
| 4th | North Dakota | 19.38% | CDC BRFSS, binge drinking 5+/4+ drinks on an occasion, 2024 |
| 5th | Wisconsin | 19.06% | CDC BRFSS, binge drinking 5+/4+ drinks on an occasion, 2024 |
| 6th | Alaska | 18.55% | CDC BRFSS, binge drinking 5+/4+ drinks on an occasion, 2024 |
| 7th | Illinois | 18.41% | CDC BRFSS, binge drinking 5+/4+ drinks on an occasion, 2024 |
| 8th | Minnesota | 18.07% | CDC BRFSS, binge drinking 5+/4+ drinks on an occasion, 2024 |
| 9th | South Dakota | 18% | CDC BRFSS, binge drinking 5+/4+ drinks on an occasion, 2024 |
| 10th | Colorado | 17.61% | CDC BRFSS, binge drinking 5+/4+ drinks on an occasion, 2024 |
| 11th | Louisiana | 17.33% | CDC BRFSS, binge drinking 5+/4+ drinks on an occasion, 2024 |
| 12th | Rhode Island | 16.89% | CDC BRFSS, binge drinking 5+/4+ drinks on an occasion, 2024 |
| 13th | Vermont | 16.58% | CDC BRFSS, binge drinking 5+/4+ drinks on an occasion, 2024 |
| 14th | Wyoming | 16.49% | CDC BRFSS, binge drinking 5+/4+ drinks on an occasion, 2024 |
| 15th | Texas | 16.39% | CDC BRFSS, binge drinking 5+/4+ drinks on an occasion, 2024 |
| 16th | Kansas | 16.38% | CDC BRFSS, binge drinking 5+/4+ drinks on an occasion, 2024 |
| 17th | Pennsylvania | 16.38% | CDC BRFSS, binge drinking 5+/4+ drinks on an occasion, 2024 |
| 18th | Missouri | 16.25% | CDC BRFSS, binge drinking 5+/4+ drinks on an occasion, 2024 |
| 19th | Ohio | 16.15% | CDC BRFSS, binge drinking 5+/4+ drinks on an occasion, 2024 |
| 20th | Hawaii | 16.02% | CDC BRFSS, binge drinking 5+/4+ drinks on an occasion, 2024 |
| 21st | Massachusetts | 15.67% | CDC BRFSS, binge drinking 5+/4+ drinks on an occasion, 2024 |
| 22nd | Arizona | 15.66% | CDC BRFSS, binge drinking 5+/4+ drinks on an occasion, 2024 |
| 23rd | South Carolina | 15.63% | CDC BRFSS, binge drinking 5+/4+ drinks on an occasion, 2024 |
| 24th | New Hampshire | 15.56% | CDC BRFSS, binge drinking 5+/4+ drinks on an occasion, 2024 |
| 25th | Nevada | 15.51% | CDC BRFSS, binge drinking 5+/4+ drinks on an occasion, 2024 |
| 26th | California | 15.36% | CDC BRFSS, binge drinking 5+/4+ drinks on an occasion, 2024 |
| 27th | Michigan | 15.33% | CDC BRFSS, binge drinking 5+/4+ drinks on an occasion, 2024 |
| 28th | New Mexico | 15.23% | CDC BRFSS, binge drinking 5+/4+ drinks on an occasion, 2024 |
| 29th | New York | 15.17% | CDC BRFSS, binge drinking 5+/4+ drinks on an occasion, 2024 |
| 30th | Alabama | 15.11% | CDC BRFSS, binge drinking 5+/4+ drinks on an occasion, 2024 |
| 31st | Connecticut | 15.09% | CDC BRFSS, binge drinking 5+/4+ drinks on an occasion, 2024 |
| 32nd | New Jersey | 14.79% | CDC BRFSS, binge drinking 5+/4+ drinks on an occasion, 2024 |
| 33rd | Indiana | 14.73% | CDC BRFSS, binge drinking 5+/4+ drinks on an occasion, 2024 |
| 34th | Washington | 14.62% | CDC BRFSS, binge drinking 5+/4+ drinks on an occasion, 2024 |
| 35th | Oregon | 14.59% | CDC BRFSS, binge drinking 5+/4+ drinks on an occasion, 2024 |
| 36th | Maine | 14.57% | CDC BRFSS, binge drinking 5+/4+ drinks on an occasion, 2024 |
| 37th | Florida | 14.32% | CDC BRFSS, binge drinking 5+/4+ drinks on an occasion, 2024 |
| 38th | Arkansas | 14.31% | CDC BRFSS, binge drinking 5+/4+ drinks on an occasion, 2024 |
| 39th | Virginia | 13.91% | CDC BRFSS, binge drinking 5+/4+ drinks on an occasion, 2024 |
| 40th | Idaho | 13.87% | CDC BRFSS, binge drinking 5+/4+ drinks on an occasion, 2024 |
| 41st | Kentucky | 13.63% | CDC BRFSS, binge drinking 5+/4+ drinks on an occasion, 2024 |
| 42nd | Tennessee | 13.6% | CDC BRFSS, binge drinking 5+/4+ drinks on an occasion, 2024 (state value is 2023, latest available) |
| 43rd | Georgia | 13.44% | CDC BRFSS, binge drinking 5+/4+ drinks on an occasion, 2024 |
| 44th | West Virginia | 13.32% | CDC BRFSS, binge drinking 5+/4+ drinks on an occasion, 2024 |
| 45th | North Carolina | 13.29% | CDC BRFSS, binge drinking 5+/4+ drinks on an occasion, 2024 |
| 46th | Mississippi | 13.25% | CDC BRFSS, binge drinking 5+/4+ drinks on an occasion, 2024 |
| 47th | Delaware | 13.09% | CDC BRFSS, binge drinking 5+/4+ drinks on an occasion, 2024 |
| 48th | Maryland | 12.97% | CDC BRFSS, binge drinking 5+/4+ drinks on an occasion, 2024 |
| 49th | Oklahoma | 12.78% | CDC BRFSS, binge drinking 5+/4+ drinks on an occasion, 2024 |
| 50th | Utah | 11.26% | CDC BRFSS, binge drinking 5+/4+ drinks on an occasion, 2024 |
Per-row source notes (including any single-year exceptions) are shown on wider screens.
Methodology
This map ranks all 50 states by the share of adults who binge drink, from the CDC's Behavioral Risk Factor Surveillance System (BRFSS). BRFSS defines binge drinking as consuming, on a single occasion in the past 30 days, five or more drinks for men or four or more drinks for women.
Binge drinking is a measure of heavy episodic drinking, not overall alcohol use, which is why the pattern differs from what many expect: rates tend to run highest across the Upper Midwest and lowest in parts of the South. #1 is the highest binge-drinking rate. We use the most recent year available for each state and disclose any state shown with a prior year (Tennessee uses its 2023 value).
Figures are CDC's published estimates, presented with our own ranking and commentary.
Note: CDC BRFSS, binge drinking 5+/4+ drinks on an occasion, 2024 (state value is 2023, latest available)
Ranks are ordinal (1 = highest by this metric). Ties are broken alphabetically by state name.
Source & data
- Source: CDC BRFSS Prevalence Data (2011-present)Tier 1
- Data period: 2024
- Last updated: June 1, 2026
- Refresh cadence: annual
- #1 (Iowa): 20.4%
Source: CDC BRFSS Prevalence Data (2011-present)
License: Public domain (U.S. Government work)
By MAP SO HARD
Reviewed by MAP SO HARD editorial